(Upload on August 10 2015) [ 日本語 | English ]
Mount Usu / Sarobetsu post-mined peatland
From left: Crater basin in 1986 and 2006. Cottongrass / Daylily
HOME > Lecture catalog / Research summary > Glossary > Island biogeography
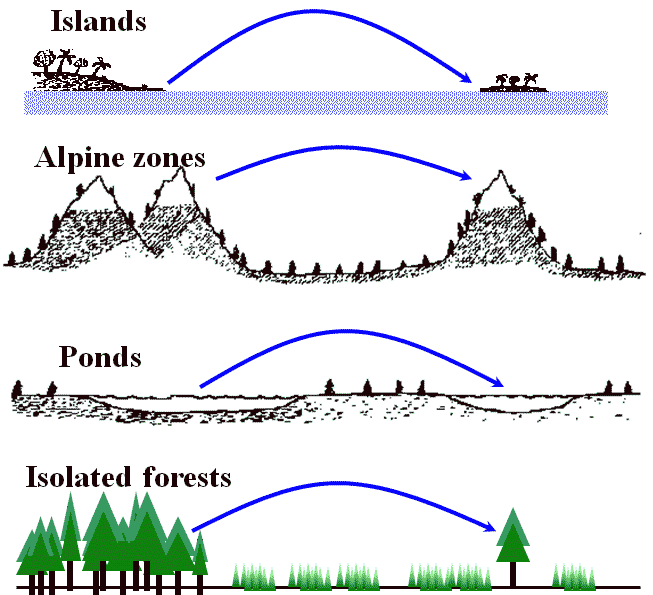 Fig. 1. "Real islands" and "habitat islands". Those kinds of islands can be analyzed by the identical numerical theory. (Wilson & Bossert 1971)
[ biogeogrpahy ] [ SLOSS ] [ network ] conservation (保全) landscape (景観) species-area curve (種数面積曲線) (Simberloff 1974) |
• requiring more time to colonize [Rejected] the saturated richness (in equilibrium) could be observed in some islands where the time is enough for the colonization |
Saturation rate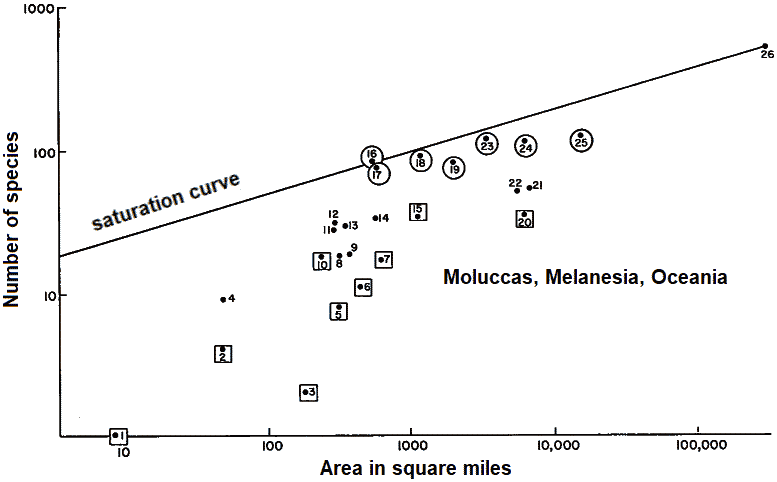 Fig. 2. The numbers of land and freshwater bird species on various islands of the Moluccas, Melanesia, Micronesia, and Polynesia. Here the archiplagoes are widely scattered, and the distance effect is apparent in the greater variance. Hawaii is included even though its fauna is derived mostly from the New World (Mayr, 1943). "Near" islands (less than 500 miles from New Guinea) are enclosed in circles, "far" islands (greater than 2,000 miles) in squares, and islands at intermediate distances are left unenclosed. The saturation curve is drawn through large and small islands at source of colonization. (1) Wake, (2) Henderson, (3) Line, (4) Kusaie, (5) Tuamotu, (6) Marquesas, (7) Society, (8) Ponape, (9) Marianas, (10) Tonga, (11) Carolines, (12) Palau, (13) Santa Cruz, (14) Rennell, (15) Samoa, (16) Kei, (17) Louisiade, (18) D'Entrecasteaux, (19) Tanimbar, (20) Hawaii, (21) Fiji, (22) New Hebrides, (23) Buru, (24) Ceram, (25) Solomons, (26) New Guinea. (MacArthur & Wilson 1963) Saturation rate vs distance from mother land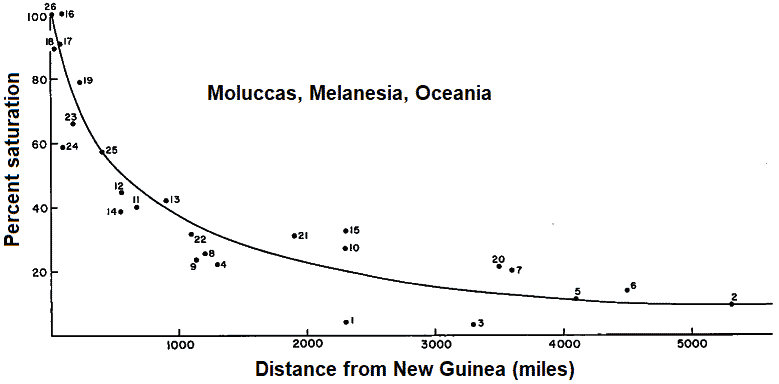 Fig. 3. Per cent saturation, based on the "saturation curve" of fig. 2, as a function of distance from New Guinea. The numbers refer to the same islands identified in the caption of fig. 2. Note that from equation (4) it is an oversimplification to take distances solely from New Guinea. The abscissa should give a more complex function of distances from all the surrounding islands, with the result that far islands would appear less "distant." But this representation expresses the distance effect adequately for the conclusions drawn. |
Immigration curve vs extinction curveImmigration rate, I - distance effect (+ richness in mother land)Extinction rate, E - size effect (island area) Replacement rate R, obtained by solving I = E 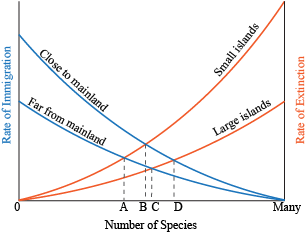 Fig. Four equilibrium points on number of species with diferent island sizes (small and large) and distance from mainland.(close and far). See also the table, shown below. Fig. Four equilibrium points on number of species with diferent island sizes (small and large) and distance from mainland.(close and far). See also the table, shown below.
Island size Large Small Alternative model of the evolutionary species equilibrium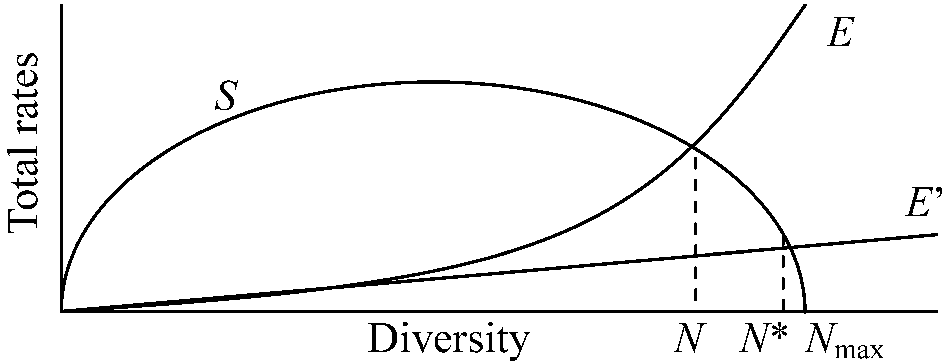 E: diversity-dependent extinction curve E’: diversity-dependent extinction curve Each N is diversity on equilibrium stage The rate of change in diversityN(t): rate of change in diversity δN/δt = S - E
S: equation 1, E: equilibrium Equilibrium value, δN/δt = 0 → N* = (1 - b/a)Nmax |
→ Which and how do we choose? ⇑ Reserve design and selection⇓ → Where do we reserve?
1. Several, large reservations |
Island biogeography + scaleZero-sum dynamics (ゼロサムダイナミクス) |
Ecological network (ecosystem netowrk)Corridors and flows
conduits: plants and animals are the primary flows along corridors Corridors (回廊)long narrow patches, contrasts with surroundings, often disturbed, migration filters, often interrupted, different microclimate Hedgerow function (生垣効果)fence effect, hedgerow as conduits, hedgerow networks and flows Ex. windbreak forest Nodes and corridorsFunction of nodes
Nodes often make loops, or alternative routes, such as railroad Network connectivityThe degree to which all nodes in a system are linked by corridors
Complexity of networks where L is the number of links, Lmax is the maximum possible number of links, and V is the number of nodes. Gamma index ranged from 0 (no link) to 1 (every node is linked to every other node) 2. Gravity model (重力分析)
Assumptions: interaction (= gravity, Tij) between centers(i, j) is: Tij = k(PiPj/dij²), k = constant |
Dispute: doubtful if the models reflect regional coidentity in all the cases - imoportant to problem setting Line TTTTT..TTTTT, ....TT..... e.g., streams
Belt (strip) TTTTTxx..xxTTTT e.g., big rivers
Networks (quadrats) TTTTxx..xxTTTT
Txx..xxTTTTxx.
xx......TTxx.. e.g., grasslands
Background matrix and networkA landscape is composed of several types of landscape elements. Of these, the matrix is the most extensive and most connected landscape element type, and therefore, plays the dominant role in the functioning of the landscape (i.e., the flows of energy, materials, and species).
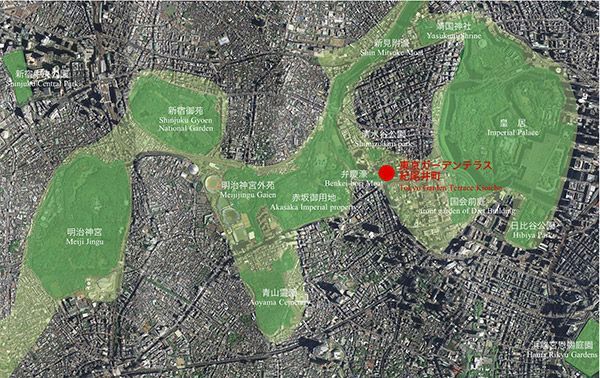
Promotingg Ecological Network by Town DevelopmentThe Tokyo Garden Terrace Kioicho promotes Ecological Network in the middle of central Tokyo by connecting precious open spaces in the vicinity where a variety of wildlife has been identified. The entire green spaces are composed with multi-layered vegetation including various local species of plants to enhance conditions close to natural ecosystem. Also, a biotope on the site is to be integrated into an ecological network along with Shimizudani Park and Benkeibori Moat as well, and provides habitats of dragonflies and butterflies.
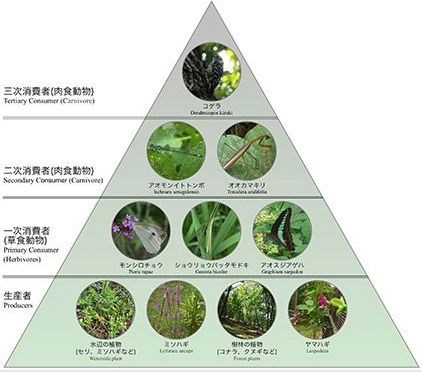 Ecological Pyramid of Returning Wildlife Ecological Pyramid:: a hierarchy of food chains with the principal predator at the top November 24 2017 |