(Upload on March 18 2023) [ 日本語 | English ]
Mount Usu / Sarobetsu post-mined peatland
From left: Crater basin in 1986 and 2006. Cottongrass / Daylily
HOME > Lecture catalog / Research summary > Glossary > Vegetation measures
The total number of individuals or amount of resources present in a specific area. Typically, used qualitative, relative, or subjective manner rather than an absolute number or amount.
For convenient use
The species is
in the given area (or ecosystem)
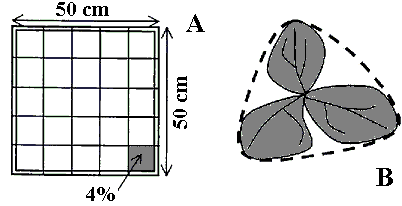
The area of ground covered by plants. Usually we use the marginal projection of the aboveground parts of plants, shown below.
|
|
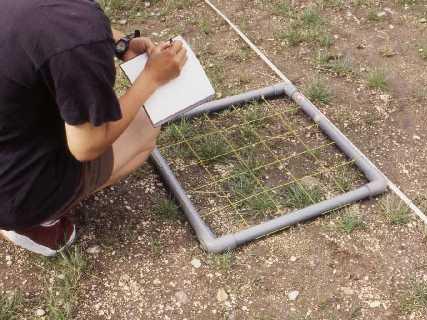
| A: An example of frame for establishing quadrat (方形区) for the measurement of cover. ← field equipment (野外調査道具) B: Cover is not for the absolute cover. We estiamte the projection of the plants, as indicated by interrupted lines. |
Table 2.1. A comparison of cover scales used to recording vegetation plots including the traditional Braun-Blanquet scale (1928), the original Domin scale (1928), a variant of the Domin scale by Krajina (1933), and the scales of the Carolina (Peet et al. 1998) and New Zealand vegetation surveys (Allen 1992). The brown letters indicate how the newer indices nest into the Braun-Blanquet scheme. (Modified after van der Maarel & Franklin 2013)
| Range of cover | Braun-Blanquet | Domin | Krajina | Carolina | New Zealand |
|---|---|---|---|---|---|
| Single individual | r, solitary with small cover | + | + | 1 | 1 |
| Sporadic or few | +, Few, with small cover (pronounced 'cross') | 1 | 1 | 1 | 1 |
| 0-1% | 1, numerous, but less than 1/20 cover, or scattered, with cover up to 1/20 | 2 | 1 | 2 | 1 |
| 1-2% | 1 | 3 | 1 | 3 | 2 |
| 2-3% | 1 | 3 | 1 | 4 | 2 |
| 3-5% | 1 | 4 | 1 | 4 | 2 |
| 5-10% | 2, any number, with 1/20-1/4 cover (5-25%) | 4 | 4 | 5 | 3 |
| 10-25% | 2 | 5 | 5 | 6 | 3 |
| 25-33% | 3, any number, with 1/4-1/2 cover (25-50%) | 6 | 6 | 7 | 4 |
| 33-50% | 3 | 7 | 7 | 7 | 4 |
| 50-75% | 4, any number, with 1/2-3/4 cover (50-75%) | 8 | 8 | 8 | 5 |
| 75-90% | 5, any number, with cover more than 3/4 of the reference area (> 75%) | 9 | 9 | 9 | 6 |
| 90-95% | 5 | 10 | 9 | 9 | 6 |
| 95-100% | 5 | 10 | 10 | 10 | 6 |
Class (%): 1 (0-5), 2 (5-25), 3 (25-50), 4 (50-75), and 5 (75-100)
(Daubenmire 1959)
The mass of living organisms in a given area (or ecosystem) at a given time. We often use dry mass for plant ecology. See also biome and productivity.
Phytomass (ファイトマス)= plant biomass (biomass of the plants only)Necromass (ネクロマス)(s.s.) organic material consisting of or derived from dead organisms(s.l.) the total mass of dead organisms (of a given type, in a given area, etc.) The measurements of biomass (バイオマス測定法)Destructive method: harvest
AG = aboveground, BG = belowground (root)
nd = new dead mass, assumued to be stanidng dead mass rd = relative rate of decomposition Semi-destructive method ☛ allometry (アロメトリー)Harvest (刈取)Table. NPP estimation procedures (Scurolck et al. 2002).Method. Calculation. Assumptions 1. Peak live biomass = max(AGbm)
any dead mass is carried over from previous year |
2. Peak standing crop (live plus dead matter)
= max(AGbm + AGdm) any standing dead mass is formed in current year 3. Maximum minus minimum live biomass = Max(AGbm) - Min(AGbm)
same with Method 1 + = Σ(ΔAGbm/Δt), when ΔAGbm/Δt > 0
most growth occurs between successive sampling intervals (simultaneous growth and death do not occur)
= Σ(ΔAGbm + ΔAGnd)/Δt or simultaneous growth, death and decomposition do not occur 7. Sum of changes in live and dead biomasswith adjustment for decomposition = Σ[Δ(AGbm + AGdm + AGrd × AGrd)/Δt complicated |
[ productivity ]
Biomass profile or diagram (生産構造図)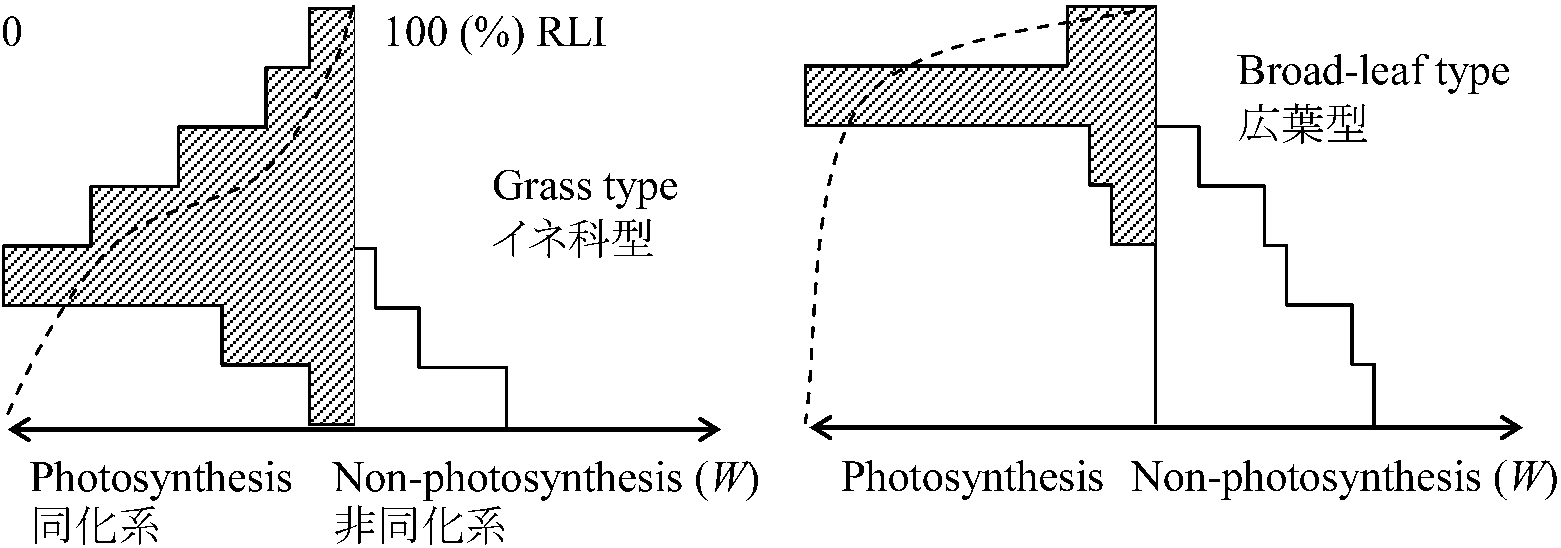
RLI = relative light intensity |
Protocol
|
Density (密度)The number of plants per unit area. Usually we use this parameter for trees and plants of which individuality is clearly recognized.Frequency (頻度)Number of plots that the target species occurs.Dominant species (優占種)Species that is (are) dominant in the given area. The dominant species often characterize the community structure and function. |
TypesRelative density (相対密度, %)= (number of individuals of a species)/(total # of individuals) × 100 Relative dominance (相対優占度) (%) = (dominance of a species)/(dominance of all species) × 100 Relative frequency (相対頻度) (%) = (frequency of a species)/(sum frequency of all species) × 100 Importance value (重要度) (IV) = Relative density + relative dominance + relative frequency (Max = 300), or = (Relative density + relative dominance + relative frequency)/3(Max = 100) |