Top
ヘッダー

(Upload on May 17 2021) [ 日本語 | English ]

Meta-analysis (メタ解析)


Mount Usu / Sarobetsu post-mined peatland
From left: Crater basin in 1986 and 2006. Cottongrass / Daylily

The statistical analysis of a large collection of analysis results from individual studies for the purpose of integrating the findings (Glass 1976)

Synonyms: quantitative review, study synthesis, and research integration

Procedures

To evaluate and integrate various research

Primary analysis = original research
Secondary analysis = re-research by the other researchers

Meta-analysis = obtaining summarized statistics

Effect size
meta-analysis

Mantel-Henzel method (M-H method)
Peto method
Der Simonian-Laird method
General variance-based method

→ should be applied to volcanic succession (火山遷移)
索引

Effect size (効果サイズ)


For the reader to fully understand the importance of your findings, it is almost always necessary to include some index of effect size or strength of relationship in your Results section (APA 2001).
p is dependent on sample size
                    N  mean  SD    t       p     Choen's d
    Experiment 1                 1.52    > 0.05    0.56
        Group A    15   25    9
        Group B    15   20    9
    Experiment 2                 2.15    < 0.05    0.56
        Group A    30   25    9
        Group B    30   20    9
p-value can not show: uncertaintity, direction and intensity of effect

Effect size

t-test: d
ANOVA: f, f2, η, η2

η2 = f2/(1 + f2)

ANCOVA: f
(multiple) regression: f
MANOVA: f2
χ2-test: w
Confidence interval of effect size
Interval estimates: should be given for any effect sizes involving principal outcomes
R packages
rpsychi
compute.es
MBESS
Table 1. Guidelines for calculating, reporting, and interpreting effect sizes (ESs) (Durlak 2009)
  1. Choose the most suitable type of effect based on the purpose, design, and outcome(s) of a research study
  2. Provide the basic essential data for the major variablesa
    1. for group designs, present means, standard deviations, and sample size for all groups on all outcomes at all time points of measurement
    2. for correlational studies, provide a complete correlation matrix at all time points of measurement
    3. for dichotomous outcomes, present the cell frequencies or proportions and the sample sizes for all groups
  3. Be explicit about the type of ES that is used
  4. Present the effects for all outcomes regardless of whether or not statistically significant findings have been obtained
  5. Specify exactly how effects were calculated by giving a specific reference or providing the algebraic equation used
  6. Interpret effects in the context of other research
    1. the best comparisons occur when the designs, types of outcomes, and methods of calculating effects are the same across studies
    2. evaluate the magnitude of effect based on the research context and its practical or clinical value
    3. if effects from previous studies are not presented, strive to calculate some using the procedures described here and in the additional references
    4. use Cohen's (1988) benchmarks, only if comparisons to other relevant research are impossible
a These data have consistently been recommended as essential information in any report, but they also can serve a useful purpose in subsequent research if readers need to make any adjustments to your calculations based on new analytic strategies or want to conduct more sophisticated analyses. For example, the data from a complete correlation matrix is needed for conducting meta-analytic mediational analyses.
Table 1. Strategies for obtaining effect sizes for selected SPSS analyses (Vacha-Haase & Thompson 2004)
  • Contingency table (r or odds ratio): Run the CROSSTABS procedure and select the desired effect from the STATISTICS submenu
  • Independent t test (d, η2, or ω2): Compute a Cohen's d by hand. Or, run the analysis as a one-way ANOVA using the GLM program; click on the OPTION requesting an effect size to obtain η2. Use the Hay's correction formula (ω2) if an adjusted estimate is desired
  • ANOVA (η2 or ω2): Run the analysis as an ANOVA using the GLM program; click on the OPTION requesting an effect size to obtain η2. Use the Hay's correction formula by hand if an adjusted estimate is desired
  • Regression (R2 or R2*) Run the REGRESSION procedure. Both the uncorrected R2 and the corrected variance accounted for (R2*) estimates are displayed, by default
  • MANOVA (multivariate η2 or ω2): Run the analysis as a MANOVA using the GLM program; click on the OPTION requesting an effect size to obtain η2. A corrected estimate, multivariate ω2, (Tatsuoka 1973), can be computed by hand
  • Descriptive discriminant analysis (multivariate η2 or ω2): Run the analysis as a MANOVA using the GLM program; click on the OPTION requesting an effect size to obtain η2. A corrected estimate, multivariate ω2 (Tatsuoka 1973), can be computed by hand.
  • Canonical correlation analysis (Rc2 or Rc2*): Run the analysis in the MANOVA procedure using the syntax suggested by Thompson (2000). The Rc2 is reported. Apply the Ezekiel correction by hand if a corrected value (Rc2*) is desired
Note. ANOVA = analysis of variance; GLM = general linear model; MANOVA = multivariate analysis of variance

Bias (バイアス)


= statistical bias
Feature of a statistical technique or of its results whereby the expected value of the results differs from the true underlying quantitative parameter being estimated
  • Subject bias or selection bias (対象バイアス): introduced by the selection of data for analysis in such a way that proper randomization is not achieved → the sample obtained is not representative of the population

    Spectrum bias (範囲バイアス)
    Sampling bias

    Self-selection bias
    Exclusion bias
    Berkson bias (fallacy)
    Neyman bias
    Referral bias
    Non-respondent bias

  • Research bias → misclassification

    Information bias
    Omitted-variable bias

  • Observer bias (観察者バイアス) = interviewer bias

    Recall bias (想起バイアス)

  • Experiment bias (実験バイアス)

    Funding bias (助成金バイアス) = sponsorship bias, funding outcome bias, funding publication bias, and funding effect
    Publication bias (出版バイアス)

    Reporting bias

  • Attrition bias

(Christie et al. 2020)

Addressing bias of study desings
estimation error = estimator - true causal effect

= design bias + modelling bias + statistical noise

bias
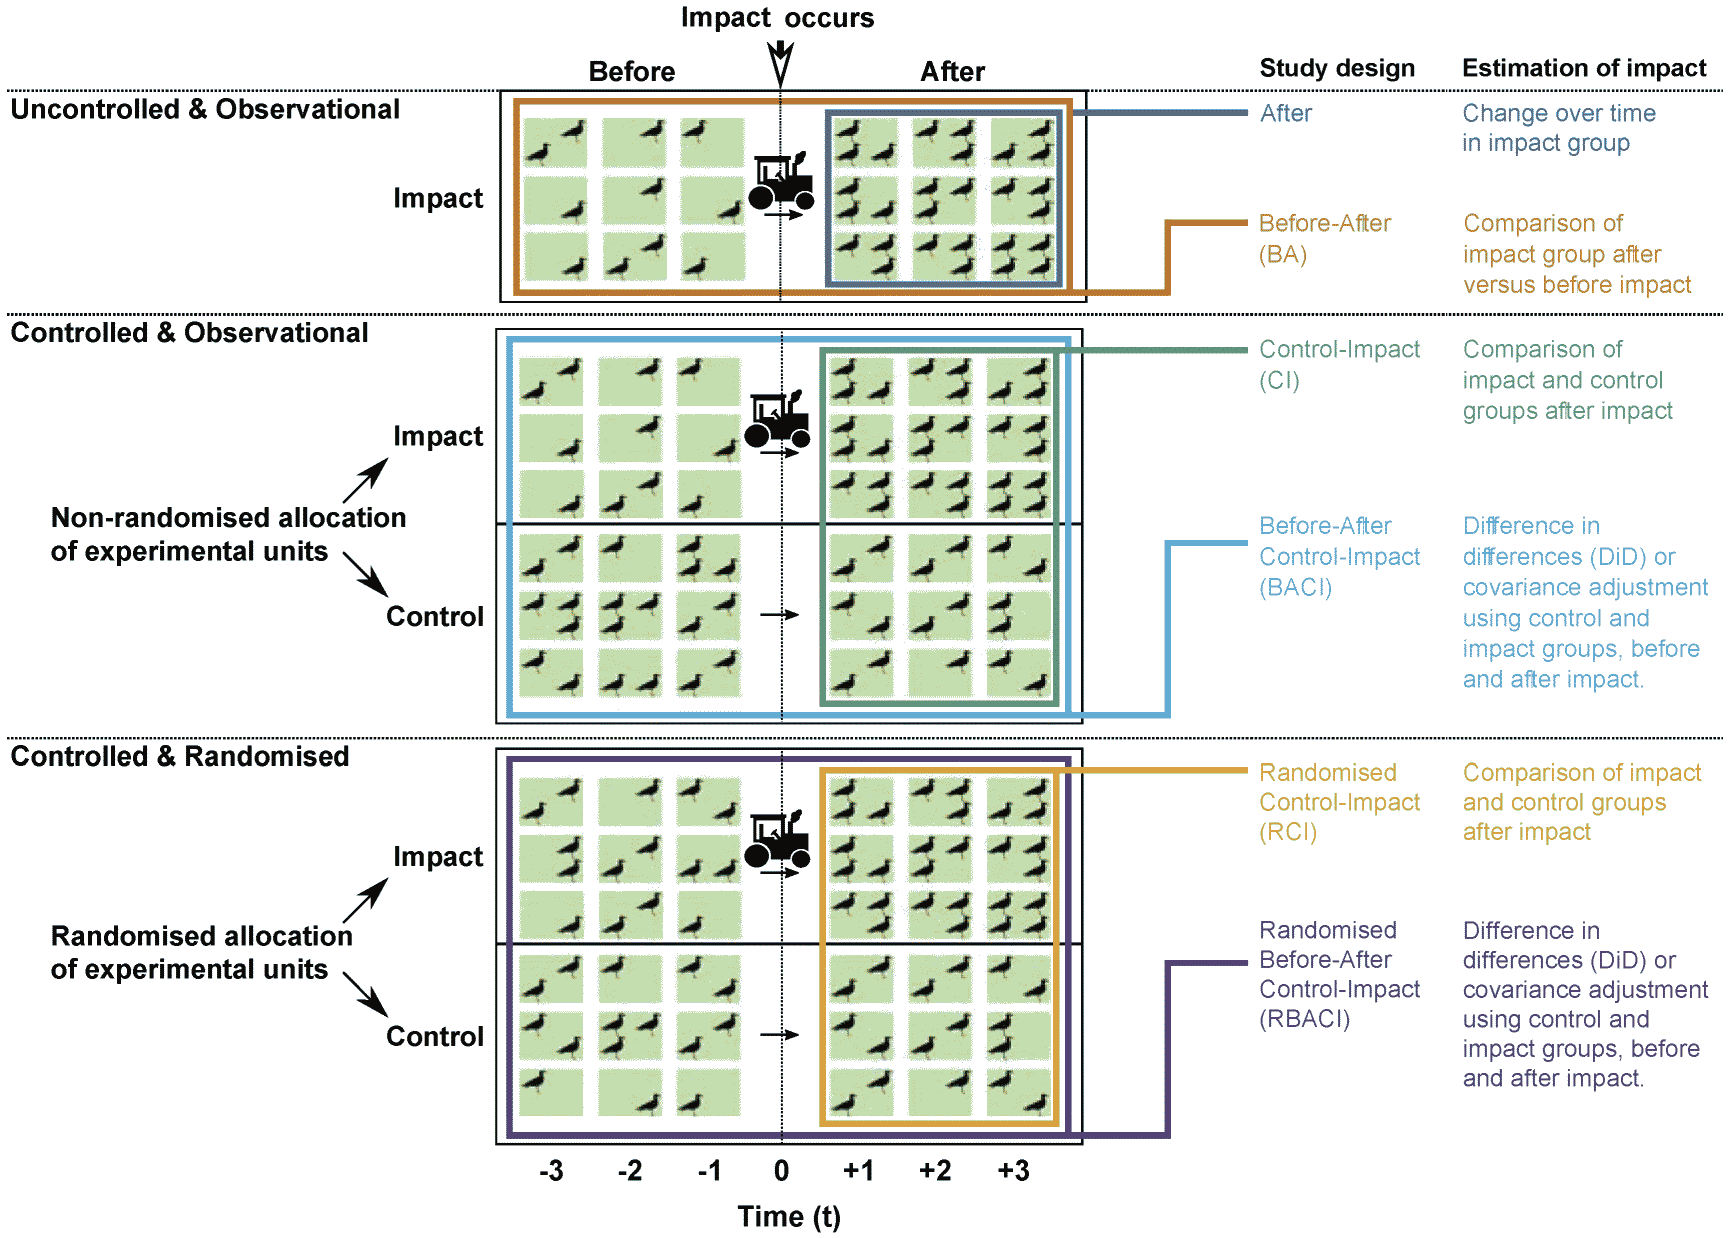
Fig. 1. Comparison of study designs to evaluate the effect of an impact. A hypothetical study set-up is shown where the abundance of birds in three impact and control replicates (e.g., fields represented by blocks in a row) are monitored before and after an impact (e.g., ploughing) that occurs in year 0. Different colors represent each study design and illustrate how replicates are sampled. Approaches for calculating an estimate of the true effect of the impact for each design are also shown, along with synonyms from different disciplines.

Synonyms of study designs:
After = time series, single-group observational
Before-after (BA) = interrupted time series, longitudinal pre-post test
Control-impact (CI) = space-for-time substitution (SfT), impact vs. reference, controlled
Before-after control-impact (BACI) = controlled before-after
Randomized control-impact (RCI) = randomized controlled trial (RCT)
Randomized before-after control-impact (RBACI) = randomized controlled before-after

Ex. skislope vegetation = after, larch damaged by typhoons on Mount Koma = before/after

Causal inference (因果推論)


Causal inference in statistics (統計的因果推論)

Causal impact (eamined by a library CausalImpact in R)
Propensity score, PS (傾向スコア)
Regression discontinuity design, RDD (回帰分断デザイン)
Method of instrumental variables, IV (操作変数法)
フッター