(Upload on December 4 2025) [ 日本語 | English ]
Mount Usu / Sarobetsu post-mined peatland
From left: Crater basin in 1986 and 2006. Cottongrass / Daylily
HOME > Lecture catalog / Research summary > Glossary > Geographical Information System
[ remote sensing | NDVI | aerial photograph ]
|
A GIS is a collection of information technology, data, and procedures for collecting, storing, manipulating, analyzing, and presenting maps and descriptive information about features that can be represented on maps (Huxhold & Allan 1995) Geographic information system (GIS): A computer system, incluidng hardware and softwawre, provides tools for capturing, storing, checking, integrating, manipulating, analyzing and displaying data related to positions. [ Software for GIS ( FOSS4G )| references ] |
|
Vector dataThe data are given by coordinates and the attributes.Raster data
 Basic structure of raster data (red mesh). Stem densities of Larix kaempferi in 1963 (left), 1973 (center), and 1990 (right), determined from aerial photographs. (Kondo & Tsuyuzaki 1999) Most data obtained by remote sensing are recorded by raster. |
OverlayEx. Geographic database + Landuse + Water surface + Road networks + Buildings + Elevation → Actual world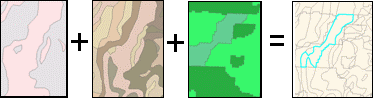
Spatial analysis (Geostatistics, 空間統計学)
|
FOSS4G, free open source software for geospatialDisktop GIS: GRASS GIS*, Quantum GIS (QGIS)WebGIS: OpenLayers Web mapping: OpenLayers, GeoServer Spatial database: PostGIS Library for geospatial data: GDAL/OGR (data transfer) Web-base platform: MapGuide, OpenSource Coordinate transformation: PROJ4 Application: pgRouting * geographic resources analysis support system Reference pages for WebGIS |
SharewareArcGIS: The license is supported by Software License Registration System, Hokkaido UniversityWebGISFusion of internet and GIS → brosing and oeprating the data in the field with handling a terminal of protable GPSNo specific softwares are requred → GIS is operated only by browser through internet |
|
s.l. The measurement or aquisition of information of some property of an object or phenomenon by a recording device that is not in physical or intimate contact with the object or phenomenon at a distance. s.s. The technique employs such devices as the camera, lasers, radio frequency receivers, radar systems, sonar, seismographs, gravimeters, mangetometers, and scintillation counters. Characteristics of sensorsMajor attributes of remotely sensed data (McGraw et al. 1998)Attribute: explanation Radiometric: Number of shades of grey levels and range of brightness values sensed Spectral: Number of wavelength bands and the extent of the electromagnetic spectrum sensed Spatial: Size of the smallest object that can be resolved and the total area imaged Temporal: Period between image collection of the same site and total period of image collection HYDICE (hyperspectral digital imagery collection experiment
resolution = 0.75 m, 210 bands = satellite-based systems that provide global positioning, navigation and timing services GPS, GLONASS, Galileo, BeiDou and QZSS (including Michibiki) Minimum of 4 satellites are needed to obtain a 3D positionSignals include satellite position and time of transmission The receiver uses trilateration to compute its location |
Geoid correction (ジオイド補正): the process of converting GNSS-derived ellipsoidal heights (楕円高) to orthometric heights (標高/海抜, elevation above mean sea level) by accounting for the geoid height (ジオイド高) at a given location LIDAR, Lidar or LiDAR (ライダー)= Light Detection and Ranging or Laser Imaging Detection and Ranging= Laser radar usually using UV, visible light and near-infrared light (NIR) Principles→ a sensor emits laser pulses toward a target, e.g., ground, vegetation → the time it takes for each pulse to return is recorded → this time is converted into distance, producing a point cloud
a dense collection of 3D coordinates Applications: forest ecology, topography, archaeology, autonomous vehicles, smart devices Types of LiDAR systems: Airborne LiDAR: drones or aircraft, e.g., for large-scale forest mapping Terrestrial LiDAR: ground-based - used for detailed scans Mobile LiDAR: vehicles - road and infrastructure mapping iPhone LiDAR scannerTime of flight (ToF) → possible to get 3D scanning image
direct ToF (dToF) - low accuracy
field data collection app Ex. FieldLogger |
OrganizationJAXA (Japan Aerospace Exploration Agency)
Formerly NASDA (National Space Development Agency of Japan) → SGLI (second generation global imager) GCOW-W (GCOM-Water) NASA (National Aeronautics and Space Administration)MOIDS: FPAR Applications↓↑ Climate - global change drivers↓↑ Ecosystem - ecosystem processes ↓↑ Organisms - biodiversities
NPP and biodiversity vulnerability assessment of ecosystem functions meteorology ⇔ ecosystem ⇔ organism Scale interaction region ⇔ landscape ⇔ plot |
NDVI LAI (leaf area index) LUE (light-use efficiency) → productivity
APAR (absorbed PAR) a parameter used in remote sensing and in ecosystem modeling that signifies the portion of PAR used by plants evapotranspirationproductivity phenology (seasonality) animal track Satellites for ecological study (Satellite ecology)NOAHTerra / Aqua
ASTER (Advanced Spaceborne Thermal Emission and Reflection Radiometer)
MSI (recolution: 10-20 m), etc. |
| satellite | country | rotation (d) | launch-close | discard | observed width | sensor | obs. wl (nm) | res (m) | remarks |
| SPOT1 SPOT2 SPOT3 SPOT4 SPOT5 SPOT6 SPOT7 |
France | 26 26 26 | 1986.2 1990.1 1993.9 1998.3 2002.5 2015.9 2014.6 | 1990.12 1997.11 | 60 km × 2 | HRV1 HRV2 HRV3 HRV4 | 500-590 610-680 790-890 510-730 | 20 20 20 10 | |
| SPOT | USA | 26 | 1998 | HIVIR/VGT | |||||
| LANDSAT1 LANDSAT2 LANDSAT3 | USA | 17-18 | 1972.7 1975.1 1978.3 | 1978.1 1982.2 1983.3 | 185 km | MSS4 MSS5 MSS6 MSS7 | 500-600 600-700 700-800 800-1100 | 80 80 80 80 | download |
| LANDSAT4 LANDSAT5 | USA | 16/17 | 1982 1984 | 1993 | 185 km | TM1 TM2 TM3 TM4 TM5 TM7 TM6 | 450-520 520-600 630-690 760-900 1550-1750 2080-2350 10.4-12.5 µ | 30 30 30 30 30 30 120 | |
| LANDSAT7 | USA | 16 | 1999 | ETM+ | 500-900 | 15 | |||
| MOS-1 MOS-1b | Japan | 23 | 1987.2 1990.2 | 1995.3 1996.4 | 100 km × 2 | MESSR1 MESSR2 MESSR3 MESSR4 | 510-590 610-690 720-800 800-1100 | 50 50 50 50 | |
| IRS-1 IRS-C IRS-D |
India | 22 | 1988 1995 1997 |
146 km | LISS1 LISS2 LISS3 LISS4 P P |
450-520 520-600 630-690 760-900 |
72.5 72.5 72.5 72.5 5.8 5.2 |
||
| NOAA a | USA | 1/2 | 1978 | 2700 km | AVHR1 AVHR2 AVHR3 AVHR4 |
580-680 725-1100 3550-3930 11.5-12.5 µ |
1.1 km 1.1 km 1.1 km 1.1 km |
||
| IKONOS | Spaceimaging → GeoEye → Digitalglobe, USA |
1999/09/24- 2015/03/31 |
11.3 km | MS/P b MS-B MS-G MS-R MS-FR |
526-929 445-516 506-595 632-698 757-853 |
0.82-1 3.3-4 3.3-4 3.3-4 3.3-4 |
|||
| QuickBird-2 (QuickBird-1, failure) |
DigitalGlobe, USA |
2001 | 16.8 km | MS/P MS-BL MS-GR MS-RD MS-FR |
405-1053 430-545 466-620 590-710 715-918 |
0.61 2.44 2.44 2.44 2.44 |
|||
| EOS-AM1 c | < 1 | 1999 | 2330 km | MODIS | R/NR | 250 | |||
| ALOS * ALOS-2 ALOS-3 | Japan | 2006 | 2011.5 | 40-350 70 70/35 | PALSAR AVNIR2 PRISM | 420-890 520-770 | 7-100 10 2.5 | ||
| WorldView WV-1 WV-2 WV-3 | USA | 2007-present 2009-present 2014-present | ca 1 m | ||||||
| Gaofen (GF-2) | China | 2014-present | P | 0.8 m 3.2 m |
Search files: Image Hunter for price (2022/05)
80-cm IK - $7/km2, 25 km2 min order per date
60-cm QB - $12.25/km2, 25 km2 min
50-cm 4-band WV2 - $12.25/km2, 25 km2 min (several dates support 40-cm at $13.65/km2)
75-cm J1 - $6.28/km2, 25 km2 min
30-cm 4-band WV3 - $15.75/km2, 25 km2 min
50-cm P1 - $6.25/km2, 25 km2 min
1.5-m SPOT - $2.375/km2, 100 km2 min
|
An indicator index that is used to evaluate green vegetation. Green plants absorb photosynthetically active radiation (PAR) for photosynthesis that consists of various wavelengths (see below). We apply the plant characteristics to estimate plant cover. That is NDVI. NDVI (normalized difference vegetation index) and related parametersReflection characteristics of vegetationHigh absorption rate: 400-500 nm (blue) & 620-690 nm (red)= chlorophyll absorption bands High reflection rate: 720-1200 nmIn the case of LANDSAT/MSS
MSS5: 600-700 nm (red) Difference vegetation index, DVI = MSS7 - MSS5 Weighted difference vegetation index, DVIW = 2.40 × MSS7 - MSS5 Normalized difference vegetation index, NDVI = (NIR - red)/(NIR + red) ⇒ range (-1, +1) NIR = near-infrared = (MSS7 - MSS5) / (MSS7 + MSS5), in the case of Landsat
Water < 0 = (green - red)/(green + red) Normalized difference water index, NDWI (Gitelson et al. 2002)
= (NIR - SWIR)/(NIR + SWIR) (Gao 1996) SWIR = shortwave-infrared
or = (TM5 - TM4)/(TM5 + TM4): using LANDSAT-TM Soil-adjusted vegetation index, SAVI (土壌調整植生指数)When the soil surface is exposed due to low vegetative cover (generally, < 40%), the reflectance of light in the red and near-infrared spectra influence vegetation index. This means taht the comparisons between different soil types are problematic. SAVI is proposed to correct the influence of soil brightness on NDVI.
SAVI = (NIR - RED)/(NIR + RED + L) × (1 + L), |
GIMMS‐NDVI3g
Requirements of NDVI data for monitoring vegetation dynamics
Normalized burn ratio, NBRproposed for highlighting burned areas and estimating fire severity
NBR = (NIR - SWIR)/(NIR + SWIR) BS = dNBR or ΔNBR = NBRpre-fire - NBRpost-fire Integrated Forest Index, IFI (Huang et al. 2008)
IFIp = √[(1/NB)·Σi=1NB{(bpi - bi)/SDi}2], Normalized difference red edge index (正規化レッドエッジ指数), NDRE = (NIR - RE)/(NIR + RE), where RE = red edge (≈ 715 nm) The indexes shown below can be calculated by RGBGreen red vegetation index, GRVI = (G - R)/(G + R) Visible atmospherically resistant index, VARI= (G - R)/(G + R - B) Red-green-blue vegetation index, RGBVI (赤緑青植生指数)= (G2 - R×B)/(G2 + R×B) Others: TGI, SIPI2, LCI, BNDVI, GNDVI, MCARI, etc. |
How to get aerial photographsSee Japanese page |
UAV, Unmanned aerial vehicle (ドローン)= RPAS (remote piloted aircraft systems) by ICAO= UAS (unmanned aircraft systems) by FAA (Federal Aviation Administration of USA) Ex. DJI Mavic 2 Pro (2019) SfM= structure from motionGNSS= global navigation satellite system |
|
= spatial statistics → spatial analysis |
| Advantages: fine-scale details of landscapes, and of spatially dependent biological processes, such as dispersal and invasion, can now be simulated with great precision, due to improvements in computer technology |
Spatially explicit model (SEM, 空間明示モデル) |
|
Def. Topology (位相幾何学): the study of spatial properties that remain unchanged under continuous transformations
focusing on continuity, connectedness, compactness and convergence, abstracting away from rigid shapes to explore the essence of closeness and neighborhoods in space
advanced fractal geometry |
Topological properties in fractal topology evolve with scale, e.g,
Scale-dependent connectivity |
Color image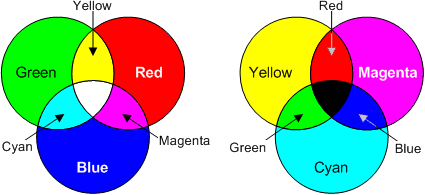 Additive and subtractive color combinations additive (light) vs subtractive (paint) |
ImageJ (ImageJ)FijiImageJ2 |
Remote SensingRecently, RS is tightly connected with GIS. Distinction between them is often useless. |
EVI
|