(Upload on February 10 2013) [ 日本語 | English ]
Mount Usu / Sarobetsu post-mined peatland
From left: Crater basin in 1986 and 2006. Cottongrass / Daylily
HOME > Lecture catalog / Research summary > Glossary > Plot
|
Sample-based (incidence) data: A common form of data in biodiversity surveys. The data set consists of a set of sampling units (such as plots, quadrats, traps, and transect lines). The incidence or presence of each species is recorded for each sampling unit. Plot: a measured area of land → rectangular plot = quadrat (s.s.) Quadrat (方形区): a square (sensu stricto) or rectangle (sensu lato), marked by stakes and/or frames to measure abundance within a given area. Quantitative evaluation: plot size is one of the most important decisions for the surveys of plant communities, because the size influences the analyses and interpretations.
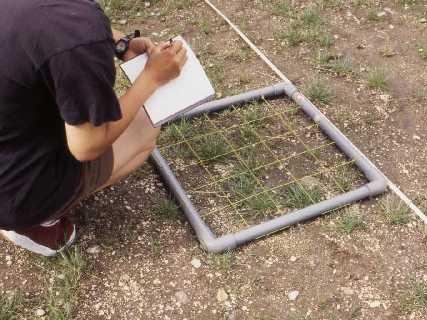
Quadrat methodsEstimation of abundance, such as cover, density and height within quadrats. By monitoring quadrats, we can detect temporal changes in vegetation (LTER).When we set up quadrats, we have to mention three characteristics. |
[ permanent plot | LTER | field equipment ]
Toposequence and chronosequence
|
These values are for vegetation survey. When we have different reseach objectives, the size should be changed depending on the purposes and costs.
Theoretical decisionmaking species-area curveEmpirical decision (for vegetation survey)Roughly saying, the size is consistent with the vegetation height. Physiognomy Vegetation height (m) Size (m)Moss / Lichens < 0.05 0.1 × 0.1 Short grassland < 1 1 × 1 (annual grassland) Tall grassland < 2 2 × 2 (perennial grassland) Shrub < 4 5 × 5 Young forest (sub-forest) < 8 10 × 10 Mature forest ≶ 8 20 × 20 |
|
one of the methods to measure the distribution and abundance across a habitat
laying out a transect line and placing quadrats at regular intervals (sometimes continuous) along the line to systematically sample species Bisect method (バイセクト法)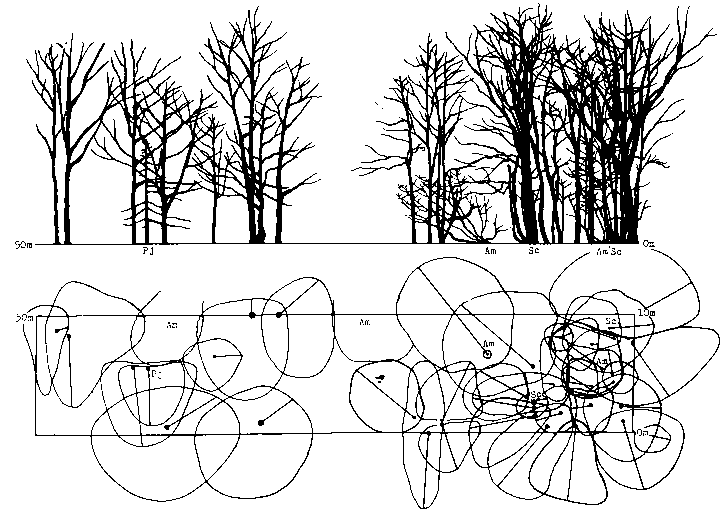 Belt transect (bisect method): a Betula ermanii forest near Masumi Pond on Mount Soranuma 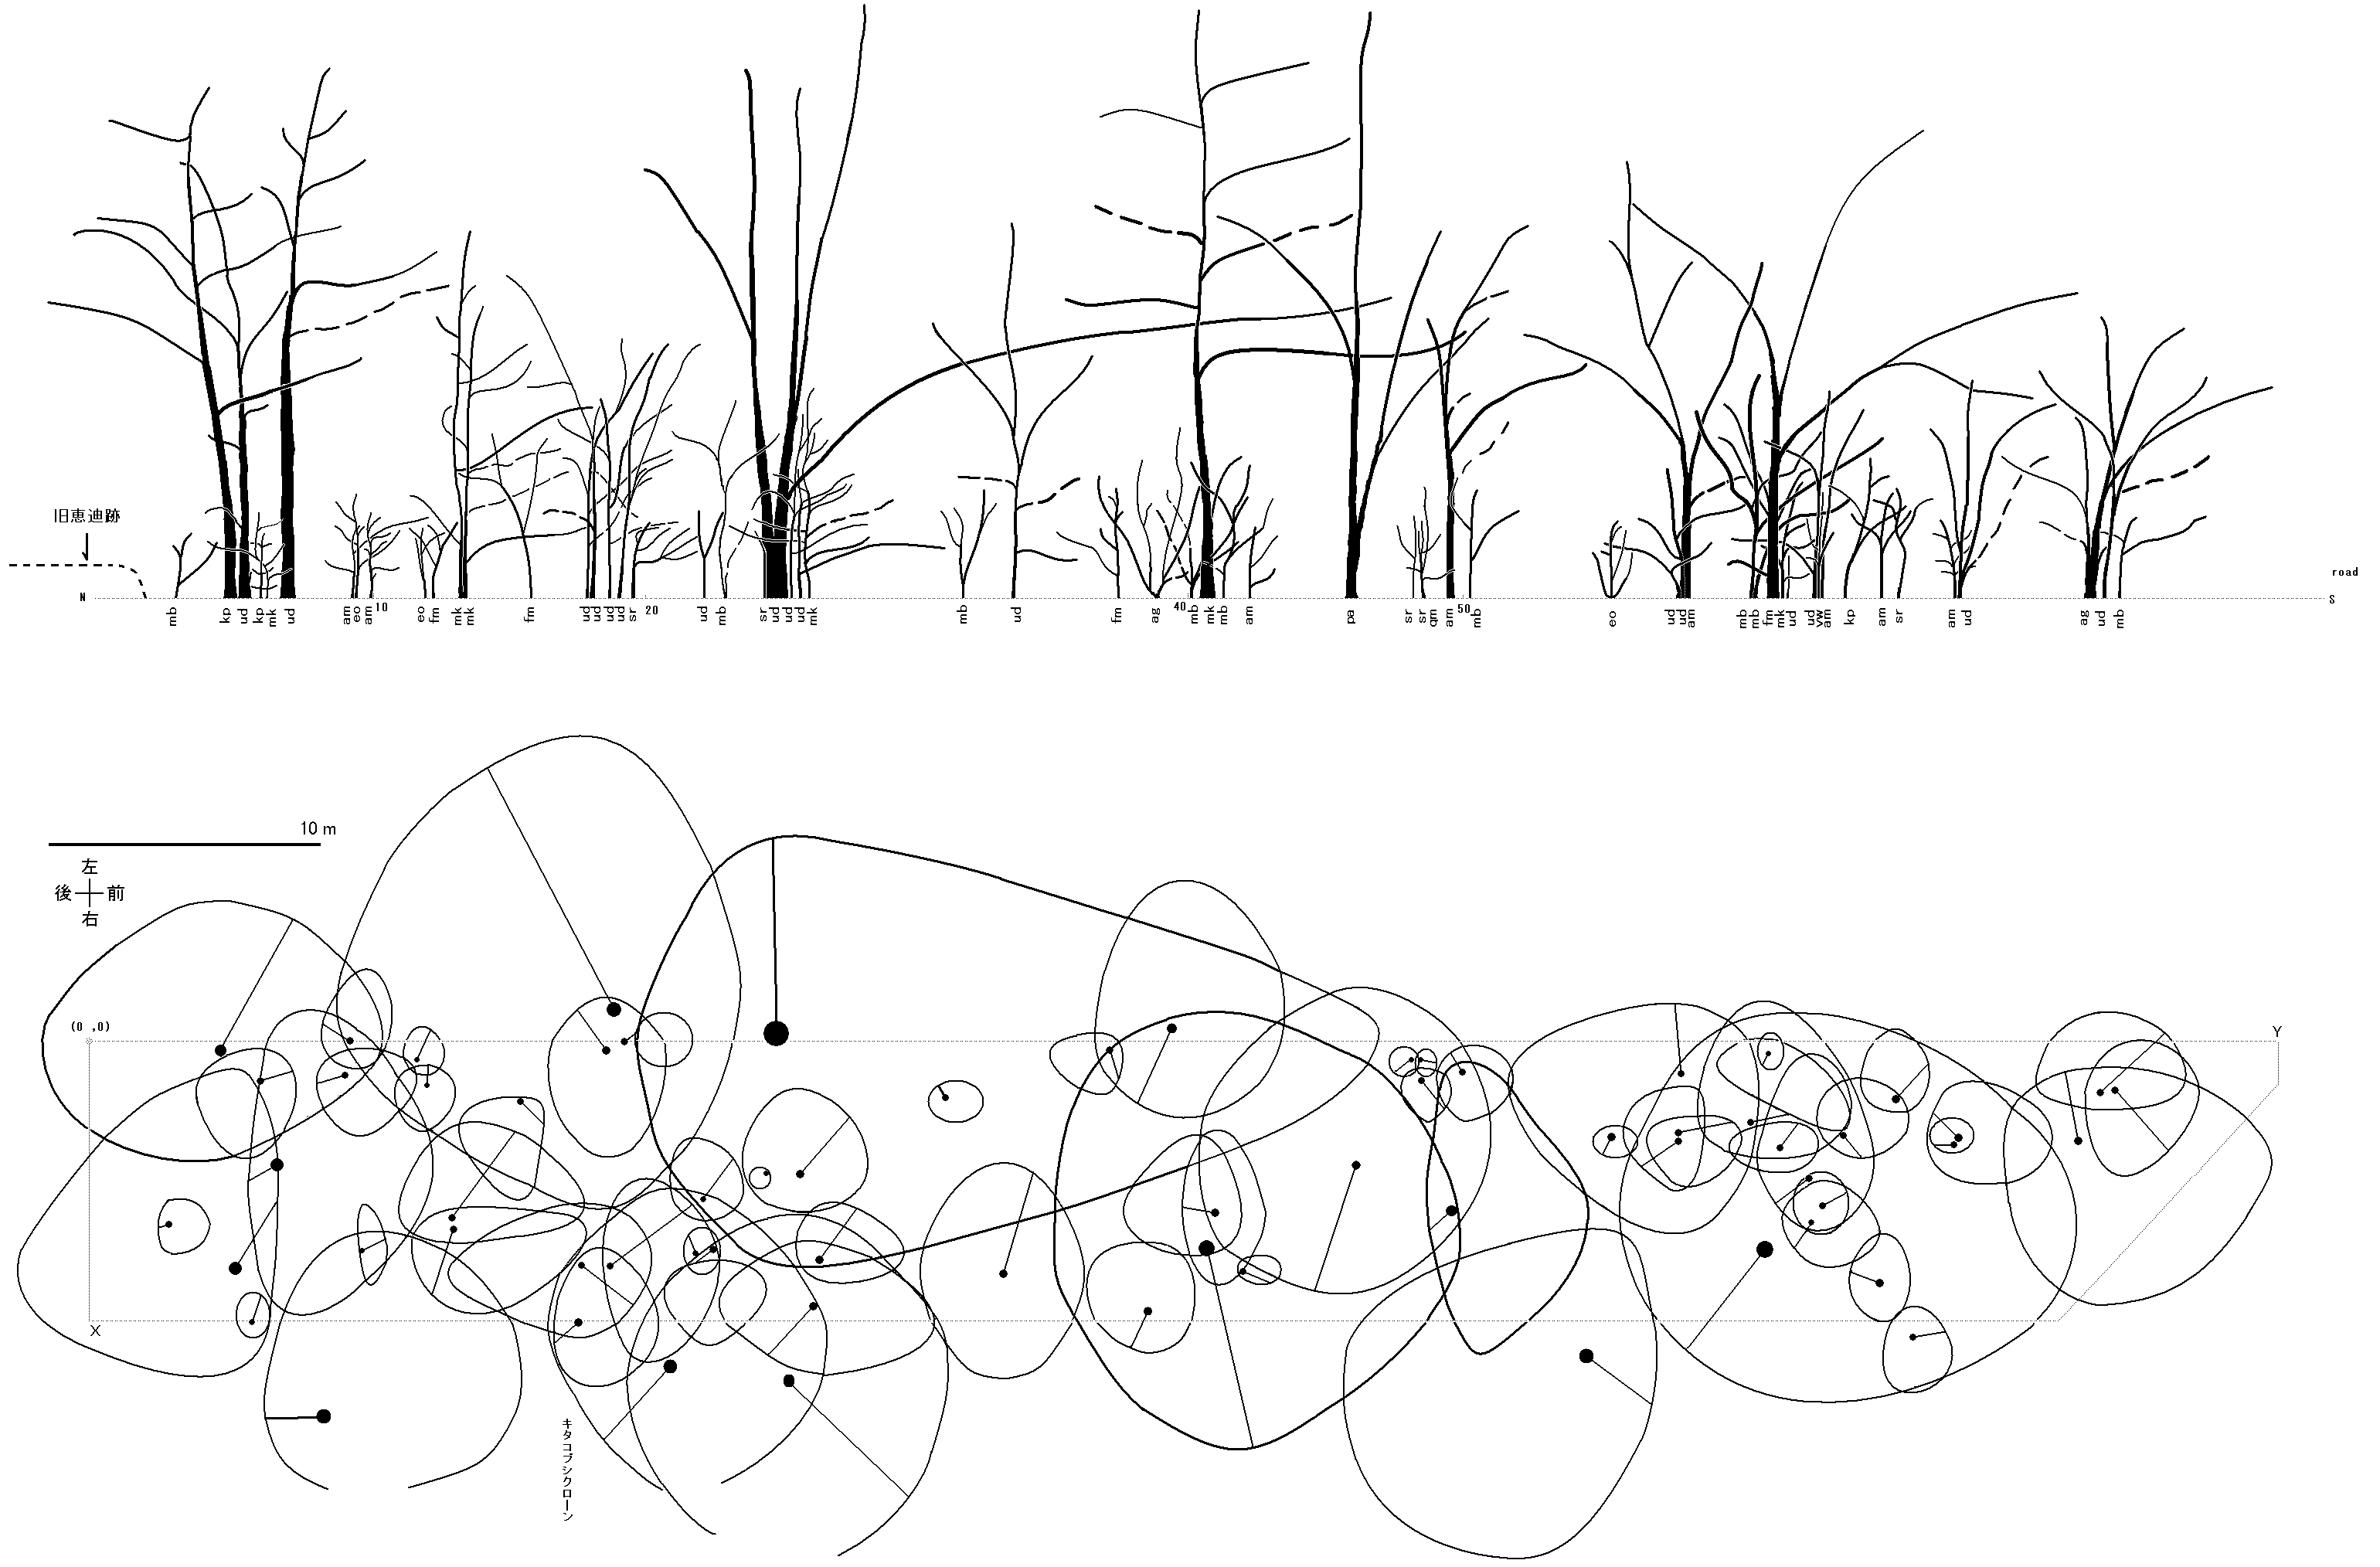 ag: Acer ginnala var. aidzuense, am: Acer mono, eo: Euonymus oxyphyllus, fm: Fraxinus mandshurica, kp: Kalopanax pictus, mb: Morus bombycis, mk: Magnolia kobus var. borealis, pa: Phellodendron amurense, qm: Quercus mongolica var. grosseserrata, sr: Sambucus racemosa ssp. kamtschatica, ud: Ulmus davidiana, vw: Viburnum wrightii Keiteki Wood surveyed in 1984. |
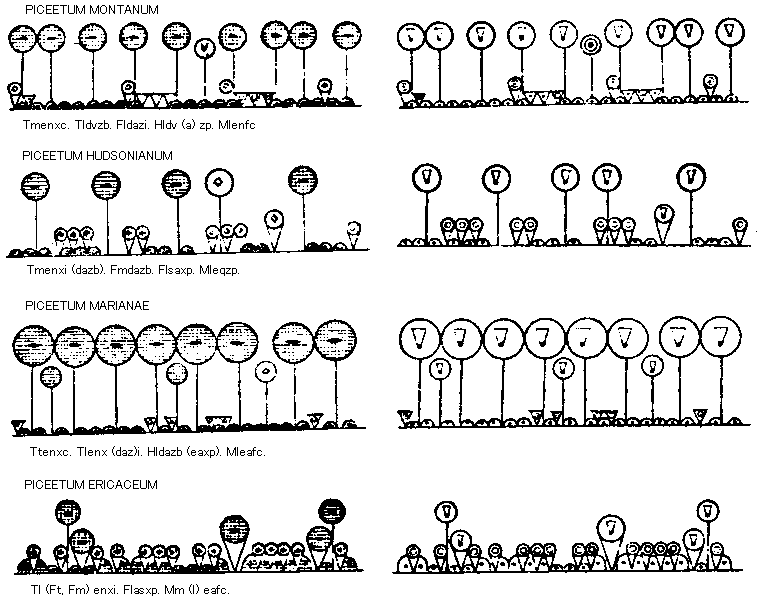 Bisect mode: Piceetum montaum - an European alpine spruce forest, Piceetum hudsonianum - a taiga in northern Canada (lichen forest), Piceetum marianae - Piceetum ericaceum on a peatland in northern Canada. [left] community structure, [right] reproduction (Dansereau & Lems 1957) |
|
Why do we need permanent plots in the study of long-term vegetation dynamics? (Bakker et al. 1996) Obtaining external and internal causes of succession Confirming the pathways of succession directly
Chronosequence (クロノシークエンス) is not enough to understand successional change because site history is so often important (Pickett 1989) Nature conservationThe geographical distribution of permanent plots (quadrats) in the Netherlands (Smits et al. 2002) → 70 years of permanent plot research in the NetherlandsMost long-term ecolgocial research (LTER) have been conducted by permanent plots. |
Permanent plots I have monitored
|
|
1980: US LTER Network was founded in USA. 1993: International LTER (ILTER) Network was founded in 1993, following LTER and others. Purposes
= 日本長期生態学研究ネットワーク
2006.11 launced BioTIMEOpen-access database of biodiversity time series, following the guiding principles of FAIR data (Dornelas et al. 2017)Ecosphere 2021, 12: e0430-e0434 Results of LTERForecasting earth's ecosystems with long-term ecological researchInsights from the U.S. Long Term Ecological Research NetworkBonanza Creek (boreal), Kellogg Biological Station (agricultural and freshwater), Palmer (Antarctica), and Harvard Forest (temperate forest) LTER sites (Bahlai et al., e0430) Cascading effectsThe stories highlight the need for long-term studies to sort out the complexities of different types of ecological cascades (e.g., trophic cascades including nutrient addition)Sites: Bonanza Creek (boreal), Kellogg Biological Station (agricultural and freshwater), Palmer (Antarctica), and Harvard Forest (temperate forest) Def. cascading effects: including a wide array of unforeseen chains of events that result from a variety of actions or changes in a systemEx. global warming → fire activity (scale, intensity, interval, etc.) → ecosystem changes (in balck spruce forests) → decrease in permafrost → further ecosystem changes
Ex. human management and disturbance → forest composition |
(Rastetter et al., e0431) Time lagsQ. what factors are best indicators of lagged changes? - hard to detect because 100 years are not enough timespan to detect time lagsSites: Arctic (tundra), California Current Ecosystem (coastal upwelling), Coweeta (montane forests), and Florida Coastal Everglades (freshwater and coastal wetlands) Multiple element limitation model (MEL) ⇒
C: lag = 20 years (Iwaniec, et al., e0432) Connectivity(Zinnert et al., e0433) State changesSites: Georgia Coastal (coastal marsh), Konza Prairie (mesic grassland), Luquillo (tropical forest), Sevilleta (arid grassland) and Virginia Coastal (coastal grassland) 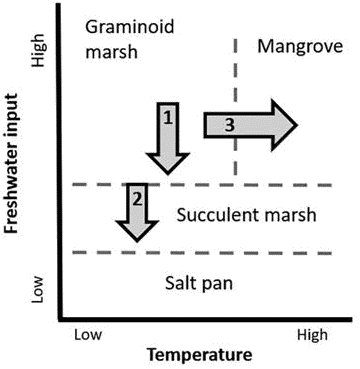 Fig. 1. Response of Georgia marshes to changes in freshwater input and temperature. Conceptual model of how variation in freshwater input and temperature leads to four different habitat types in coastal wetlands (Gabler et al. 2017).
(Cowles et al., e0434) Resilience= the capacity of a system to maintain structure and processes in the face of disturbance(1) Resilience research has matured over the past 40 yr of the LTER program (2) there are many examples of high resilience among the ecosystems in the LTER network (3) there are also many warning signs of declining resilience of the ecosystems we study Sites: Baltimore (urban), Hubbard Brook (northern hardwood forest), Andrews (temperate rain forest), Moorea (coral reef), Cedar Creek (grassland), and North Temperate Lakes (lakes) |