(Upload on May 28 2025) [ 日本語 | English ]
Mount Usu / Sarobetsu post-mined peatland
From left: Crater basin in 1986 and 2006. Cottongrass / Daylily
HOME > Lecture catalog / Research summary > Glossary > Soil
Soil scienceThe study of soil as natural resources including the properties, formation, classification and mapping. It is tightly related to ecology, forestry and agriculture
Pedology (基礎土壌学): pedogenesis + soil morphology + soil classification ≈ soil science
soil_→ → climate |
[soil formation process, duff, litter, decomposition rate] Pedosphere (土壌圏)The outermost layer of the earth that is composed of soil and subject to soil formation processes → geosphere[outdoor belowground survey] |
particles (solid) + water (liquid) + air (gas)
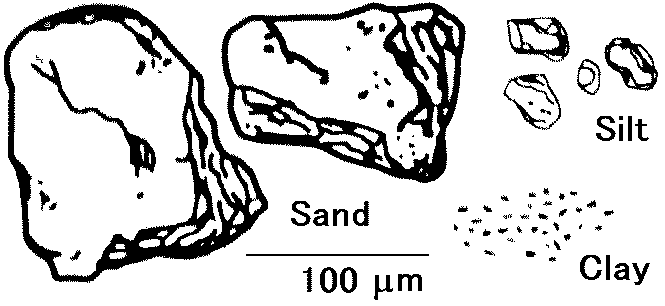
ParticlesSoil texture (土壌粒径): sand > sild > clay
Claymuddy with much waterhard when dry contained in muddy water
|
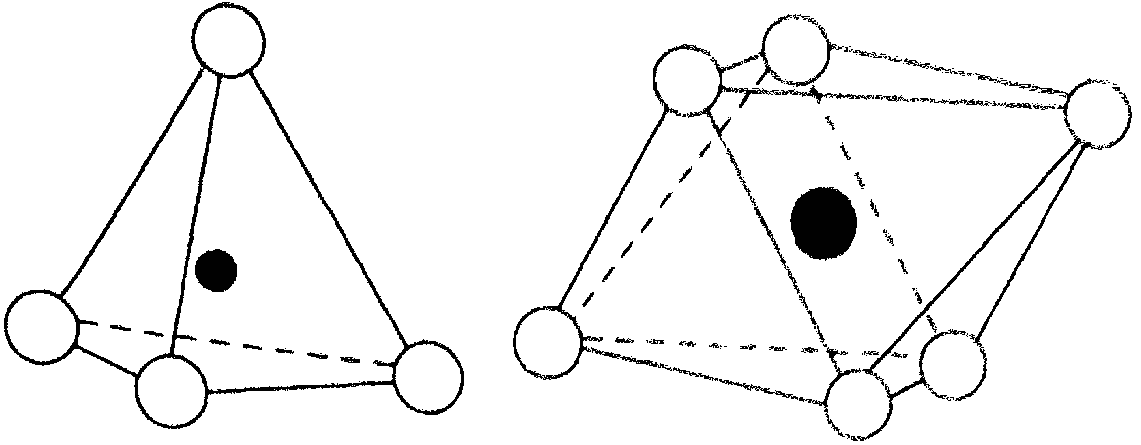
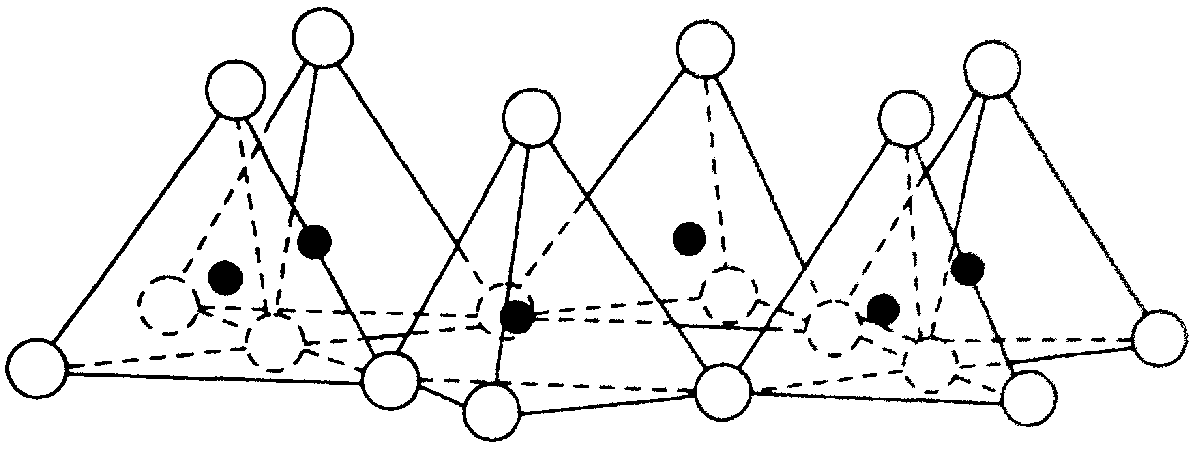 Hexahedral network of tetrahedra forming a silica sheet 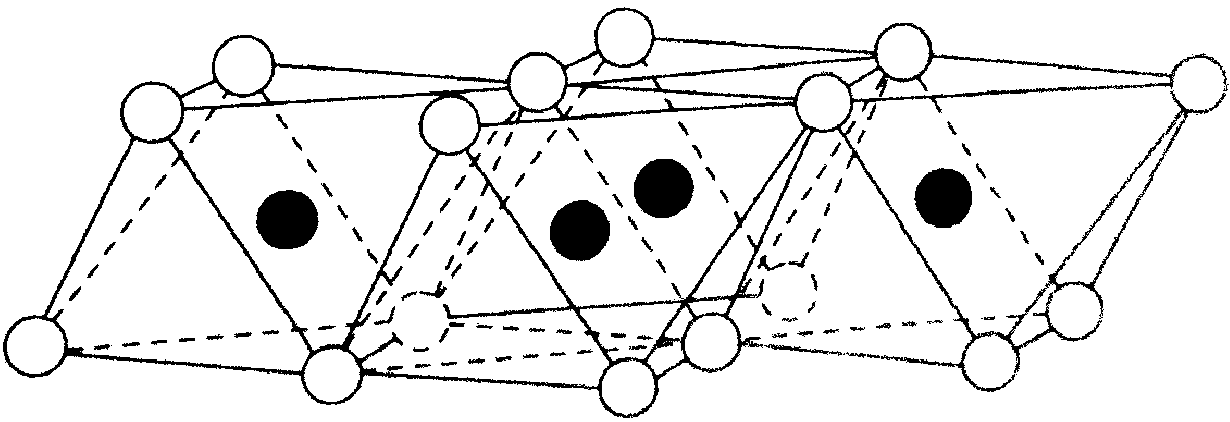 Structural network of octahedra forming an alumina sheet |
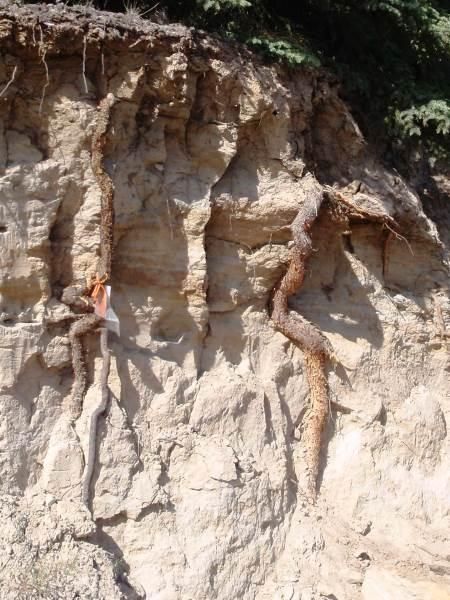
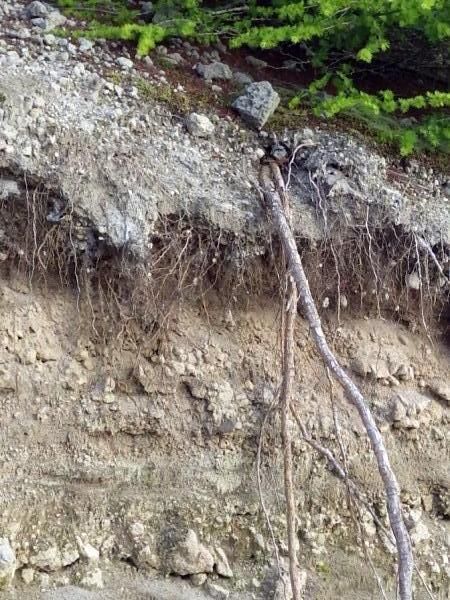
Soil profile (土壌断面)Soil profile refers to the layers of soil, horizons (L, F, H,) A, B, and C. Each layer is subdivided to the sublayers if needed.L : litter F : fermentation H : humus A : made of highly decomposed organic matter B C : mostly bedrock 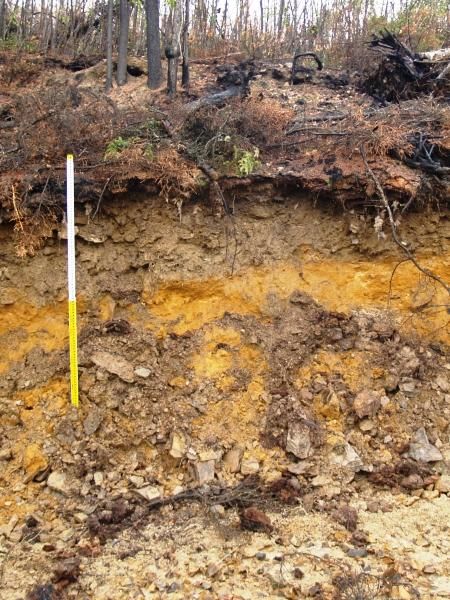 1 1
 2 2
 3 3
[1] at Poker Flat, AK, on May 18 2005. The ground surface was covered with Picea mariana and Sphagnum spp. [2] near UAF. Fairbanks, on August 5 2013. We can see tough roots! [3] un-develped soil profile taken on August 4, 2015, on the southwestern slope of Mount Koma, southern Hokkaido, after the 1929 eruptions. |
Duff (腐葉層)Organic matter layer (O layer) is divided into two indistinct layersLitter (L):consists of the loosely packed, largely unaltered dead remains of animals and plants usually recently cast.Duff (D)Consisting of two layers(F) = an upper F layer: consisting of litter which has recently begun to decompose but with the particles still recognizable as to their origins (H) = a lower H layer: is made of well-decomposed organic matter (= humus) which can not be recognized as to its origin. |
0. Sand, silt, peat and humus1. V.V. Dokchaen (1900)A: Zonal soil distributionB1. Successional soil B2. Azonal soil (edaphic soil) 3. Comprehensive soil group (USDA 1960)Nomenclature of soil taxonomy (12th revision, 2014)The history of soil classification after 19601960 Seventh Approximation published by US soil survey staffISSS Congress asks FAO to prepare world soil map 1967 Russian classification updated (Ivanova and Rozov)1972 Soil Taxonomy published by Soil Survey Staff French soil classification system (CPCS) 1974 Legend of the world soil map (FAO/UNESCO)1980 Last volume and map sheet soil map of the world 1982 the international reference base (IRB) for soil resources (ISSS) 1988 revised legend of the soil map of the world (FAO/ISRIC/UNESCO) |
1992 IRB Working Group decides
to use the revised legend of the world soil map as a basis for the ISSS system. IRB working group renamed as WRB 1994 WRB produces draft world reference base at ISSS CongressDraft topsoil characterization presented 1995 FAO produces digital world soil map anddecides together with ISRIC and UNEP to undertake an update of the map using the principles of the SOTER manual 1996 Australian soil classification system revised (Isbell)1998 WRB working group produces
the world reference base for soil resources in three volumes endorsed and adopted by IUSS as the official soil correlation system of the international union of soil scientists WRB as correlation system for Europeean soil map 2000 SOTER adopts WRB as a reference system to classify soil profilesISSS: International Society of Soil Science WRB: World Reference Base for Soil Resources |
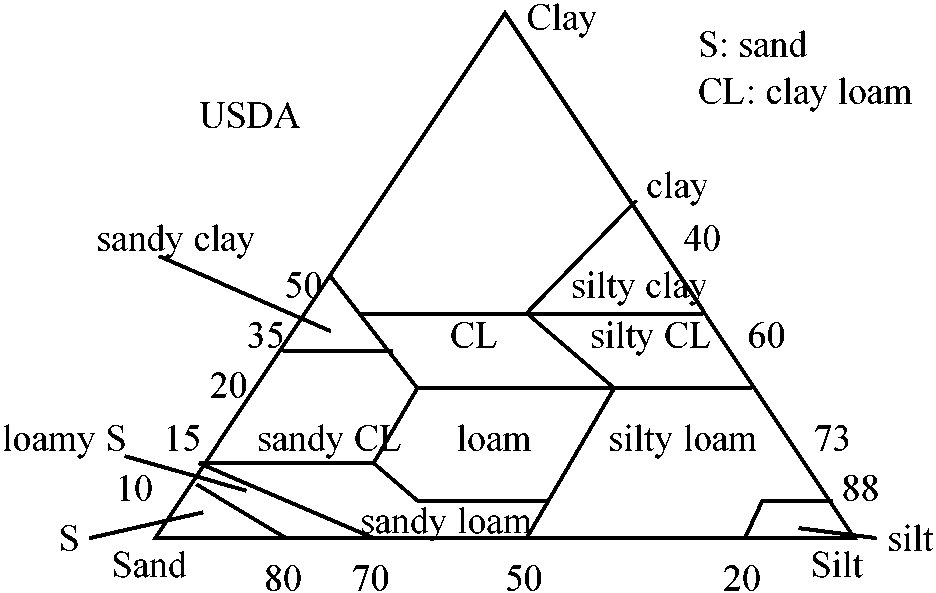
Classification of soil texture (土性区分)Fig. Triangular chart of soil texture 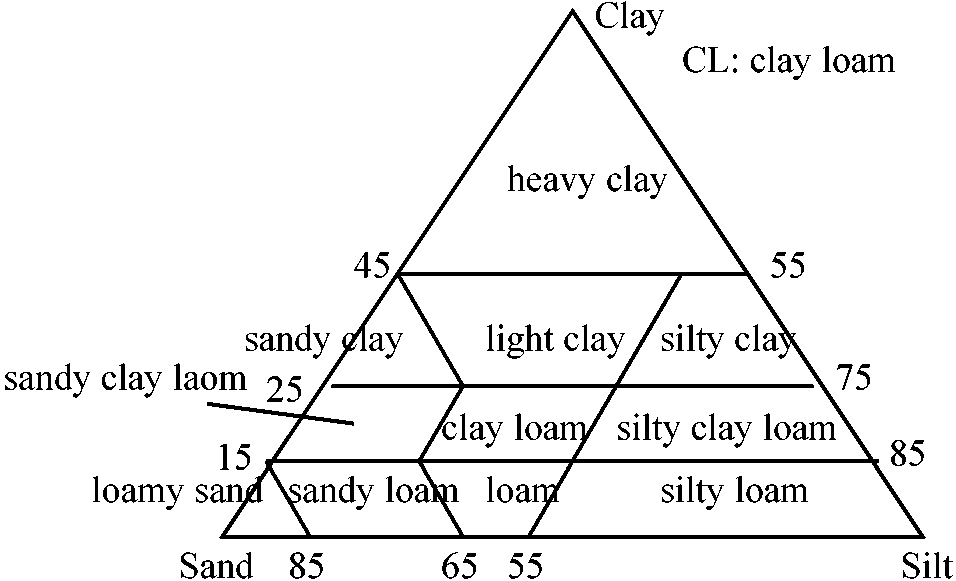 Internatinal rule (国際法): heavy clay 重埴土, light clay 軽埴土, clay loam 埴質壌土, loam 壌土, silty clay 微砂質埴土, silty clay loam 微砂質埴壌土, silty loam 微砂質壌土, sandy clay 砂質埴土, sandy clay loam 砂質埴壌土, sandy laom 砂質壌土, loamy sand 砂土 |
___ |
(Dokuchaev 1899)
|
Zonal soil: based on climate,
arid < semiarid < semihumid < humid Intrazonal soilAzonal soil Def. vapor pressure deficit (飽差), VPD (kPa): the difference (deficit) between the amount of moisture in the air and how much moisture the air can hold when it is saturated (Mayer 1926) NS quotient (NS係数)the measure of the relative humidity of a climate= N/S = N/(E - e) [mmHg]
N: mean annual precipitation (mm) S = E (saturation water vapor pressure 飽和水蒸気圧) - e (annual mean water vapor pressure 年平均水蒸気圧)
Soil
NS quotient
Examples |
Marbut CF (1863-1935, USA) 1924 soil classification and formation investigated by chemical analysis
Zonal soil group = mature soils
Pedalfars, in humid regions with Al and Fe accumulation
Tundra
Pedocals, in arid regions with Al and Ca accumulation
Chernozem (チェルノーゼム)
Intrazonal soil
Hydromorphic
Azonal soil group, including immature soil, not well-weathered
Lithosol Alkali soil (アルカリ土壌) pH > 8.5 (≠ alkaline soil > pH 7) ⇒ (1) exchangeable sodium > 15% of CEC, and/or (2) containing sufficient alkalinity (sodium) to inhibit most plant growth Black alkali soil (= solonetez): dissolved humus gives the soil a dark appearance Alkaline-tolerant plants: tolerant and adapted to alkaline soil
Ex. Festuca, grass species native to Central Asia |
|
Lithosol (岩屑土): a type of azonal soil composed mostly of unweathered or partly weathered rock fragments, often on steep slopes or mountainous terrain
≠ Regosol (非固結岩屑土): a young, less developed soil formed on loose sediments like sand or volcanic ash,often found in deserts, dunes and erosion-prone areas |
≈ Potting soilCombination of organic and inorganic materials used to provide the basic requirements for plant growth (often used for )Also used for various experiments in fields and greenhouses
Function
Organic componentsInorganic components
|
Hydrophilic gels or hydrogels (親水性ゲル)= superabsorbents: crosslinked polymers that can 400-1500 times their dry weight in water - diapers, oil recovery, food processing, water purification and wound dressings
Bio-Organics®: inorganic Polymer (mycorrhizal spores) Soil Mist®: polyacrylamide (some contain mycorrhizal spores, and one contains slow-release fertilizer) Stockosorb®: polyacrylamide (none) Viterra®: inorganic polymer (none) Zeba®: starch polymer (none) Def. soil amendment (土壌改良剤: any material added to soil to improve its physical, chemical and/or biological properties, enhancing its ability to support plant growth
primarily improving soil structure, water retention, aeration and overall health |
NH4+ in soilCalculationA ppm (mg/L) of NH4 data A is obtained from the solution which includes B gram of dry soil and 50-ml KCl This means: "A mg/L" is obtained when the solution includes B × (1 L / 50 ml) gram of soil in 1 L (the ratio between soil amount and solution is same with above) |
Then the amount of NH4 in 1000 kg of dry soil is obtained What we need to do is:
A × (1000 / (B × 20)) = C mg NH4 per 1 kg of dry soil. |
|
Phosphorus: P Phosphate: An inorganic chemical (a salt of phosphoric acid) Essential element for all living organisms Quantification of phosphateThe principle of P quantification is how stain phosphate by ammonium molybdate.Quantitative analysis of inorganic phosphoric acids (無機態リン酸)Allen's variative analysisPrinciple
Pi + 12(NH4)2MoO4 1. Standard phosphoric acid solution / KH2 = 1.0967 g/ 250 ml (# mg/ml) strictly!
2. 60% PCA (perchloric acid): hereafter, i.e., [A]
Sodium hydrogen sulfate - 8.0 g 4. 3.3% (w/w) ammonium molybdate: i.e., [C] Methods
1. put 0.1 ml standard solution in graduated test tube
5 μg 10 μg 20 μg 40 μg 60 μg 80 μg Quantification of available P in soilBray II (ブレイII)Soil: grassland, rice field, etc. Ex. 20 samples
Extract: 20 × 20 = 400 (prepare 500 ml) Phosphate in lipids extracted from litter (Prototype)Basically written by Otaki M PreparationSolvents and chemicals are of highly-quality gradeGlassware is washed by phosphate-free detergent, rinsed 10 times with hot tap water, and then 2 times with deionized water Lipid extract for lipids Chloroform : Methanol : Deionized water = 1 : 2 : 0.8, v/v/v) Fiske-Subbarow reagent 0.25% 1-amino-2-naphthol-4-sulfonic acid 13.7% sodium metabisulfite 3% sodium sulfite |
Phosphate standard
1.2 mM phenyl phosphate disodium salt Adjust 0 to 98 nmol phosphorus before use Extraction of total lipids from litterTotal lipids are extracted on the basis of a method proposed by Bligh and Dyer (1959) with modification (White et al. 1979). A total amount of 1.0 g litter si bottled into a 40-ml screw-capped centrifuge tube, and then 19.0-ml extract is poured into the tube and mixed with litter. Thereafter, 5-ml chloroform and 5-ml deionized water are added into the tube. After the samples are vortexed and centrifuged at 2000 rpm for 5 min (Kubota KS-5000), two layers are developed in the tube. The lower layer (bottom phase) that contained lipids is transferred into a new test tube.Quantification of phosphate in the lipidsProtocolLitter sample = 1.0 g freeze-dried and grinded litter↓ put into 40-mL screw-capped glass tube [Total lipids extracted by Bligh-Dyer method] ↓ 19 mL single-phased extract mixed with 10-mL methanol, 5-mL chloroform and 4 mL deionized water ↓ 29-mL two-phased extract mixed with 5-mL chloroform and 5-mL deionized water ↓ Lipid-contained lower layer istransferred into another tube ↓ The lower layer sample evapolated by jet nitrogen flow (1/10 amount of total lipid extract in the sample was used for quantifying phosphate content) [Fiske-Subbarow colorimetric determination of phosphorus]↓ add 500 μl 60% perchloric acid to the sample Phospholipids containing the total lipids are separated into organic compounds and phosphate ions ↓ Heated at 190°C for 30 minutes.↓ Mixed with 2300 μl 1.78 mM ammonium molybdate ↓ The anion was then reduced by 100-μl Fiske-Subbarow reagent (to form the blue colored β-keggin ion (PMo12O407-) ↓ Measuring absorbance at 815 nmQuantification |
Decomposition is physical and chemical brerakdown of detritus
Detritus (デトリタス, 有機堆積物)Geology: particles produced by weatheringBiology: dead materials, derived from plants, animals, and microbial organisms Speech: trash Usage: Litter decomposition |
Table. Annual production of litter in ecosystems (ton/ha) Alpine grassland = 0.55-0.99 Short grassland = 1.75 Short-tall mixed grassland = 2.10-4.27 Normal fores (leaf, wood and twig) = 6.60 Normal wood = 3.50 Beech (Fagus) forest (leaf) = 3.63 Beech (Fagus) forest (wood) = 3.50 White pine (Pinus strobus) needle leaf = 5.16 Beech-birch-ash (Fagus-Betula-Fraxinus) forest (decidous branch) = 7.04 Tropical primitive forest (leaf, wood, root) = 27.43 Tropical fabaceous forest = 60.29 Tropical savanna = 32.86 Monsoon forest = 54.86 Tropical rainforest = 111.19-222.39 |
[Litter decomposition pattern on Mount Usu]
Processes
|
Litter decomposition rate (リター分解率)Single and double exponential models best describe the loss of mass over time with an element of biological realism (Wieder & Lang 1982)Single exponential equation: y/y0 = e-kt y: remaining mass at time t, y0: initial mass, k: decay constant, or decomposition rate Litterbag (リターバッグ)A popular method to measure litter decompositioncontroversial (e.g., mesh size) Tea bag index, TBIAims: measuring mass remaining in tea bags suggest the mechanisms of organic compounts in litterPrinciples and procedures Lipton tea bags installed into soil at 8 cm deep, left for 90 days green tea sencha - faster decomposition because of leaves
estimating S, stabilization = carbon transport to soil
estimating initial decomposition rate, k
S: long-term accumulation ability Hg = 0.842 and Hr = 0.552 PredictorsC/N ratio (C:N ratio, C/N比)Chemicals in substance (soil) and initial C:N ratioLow C/N ratio → fast decomposition → good predictor However we must consider lignin:nitrogen ratio (L/N ratio): express the ratio of nitrogen that consists of lignin
Lignin is persistent C → comsumed more by bacteria N:P ratiofoligate < fresh litter < decompsed litter |
[ phosphate | qunatification | protocol ]
Also refer to White et al. (1979)
| Group | PLFA group | Marker PLFAs (*) |
| Bacteria | multiple group | sum of the all of bacteria |
| Gram-positive bacteria | Branched PLFAs | i14:0, a14:0, i15:0, a15:0, i16:0, i17:0, a17:0 |
| Gram-negative bacteria | Cyclopropyl and mono PLFAs | cy17:0, cy19:0 Hydroxy (2OH-14:0, 3OH-14:0, 2OH-16:0) |
| Actinomycetes | 10Me-PLFAs | 10Me16:0, 10Me18:0 |
| AMF | 16:1ω5c | |
| Fungi | Polyunsaturated PLFAs | 18:2ω6, 18:2ω9 |
| Protozoan | Polyunsaturated PLFAs | 20:2ω6, 20:4ω6 |
| Micro-eukaryotes | Polyunsaturated PLFAs | 18:3, 20:4 |
☛ biogeochemical cycle, soil ecology, zoology
|
1940 and after: Giliarov, Merkurii (1912-1985): developed soil zoology
the study of animals living fully or partially in the soil Soil animal (土壌動物)Es wimmelt in Boden von Unbekannten (Soil is teeming with unknowns) (Gisin 1947)1. microscopic (magnification to observe well) ☛ 2 macroscopic (no magnification to identify it) ☛ 4 2. with large claws and 8 legs ___ pseudoscorpions elongated with ≥ 10 pairs of legs ___ centipedes and millipedes worms with no segmentation, pointed ends ___ roundworms insects with 6 legs ☛ 3 3. insects with prongs visible at the end of abdomen ___ springtails elongate, either no tail prongs or long filaments ___ wingless insects 4. macroscopic worms that are tan with an expanded head ___ bipalium segmented worms with red, gray, or brown ___ earthworms macroscopic with legs ☛ 5 |
5. elongate with more than 20 legs ___ centipedes and millipedes oval with 10-16 legs (roly polys) ___ sow bugs with two body segments and 8 legsSpiders with one body segment and 8 legsTicks and Mites with 6 legs (insects) ☛ 6 6. segmented larvae with small legs and no wings ___ insect larvae large flat insects with large oval wings ___ roaches black elongate insects with large abdominal pinchers ___ earwigs small insects with constrictions between the body segments ___ ants insects with hard outerwing covers over the abdomen ___ beetles
black beetles |